
- The hypothesis What would have to happen for the plan to be wrong
- 1. The denominator What the number is a proportion of, and whether you can read it today
- 2. The comparison condition What the result is measured against, settled before it is visible
- 3. The window Which period is read, locked before launch
- 4. Concurrent activity What else runs alongside, and the rule for when it lands in a test cell
- 5. The source of the figure Who produces the number, named rather than assumed
- The claim, rebuilt All five edits in one view, from 31% to what survives
Start with the hypothesis
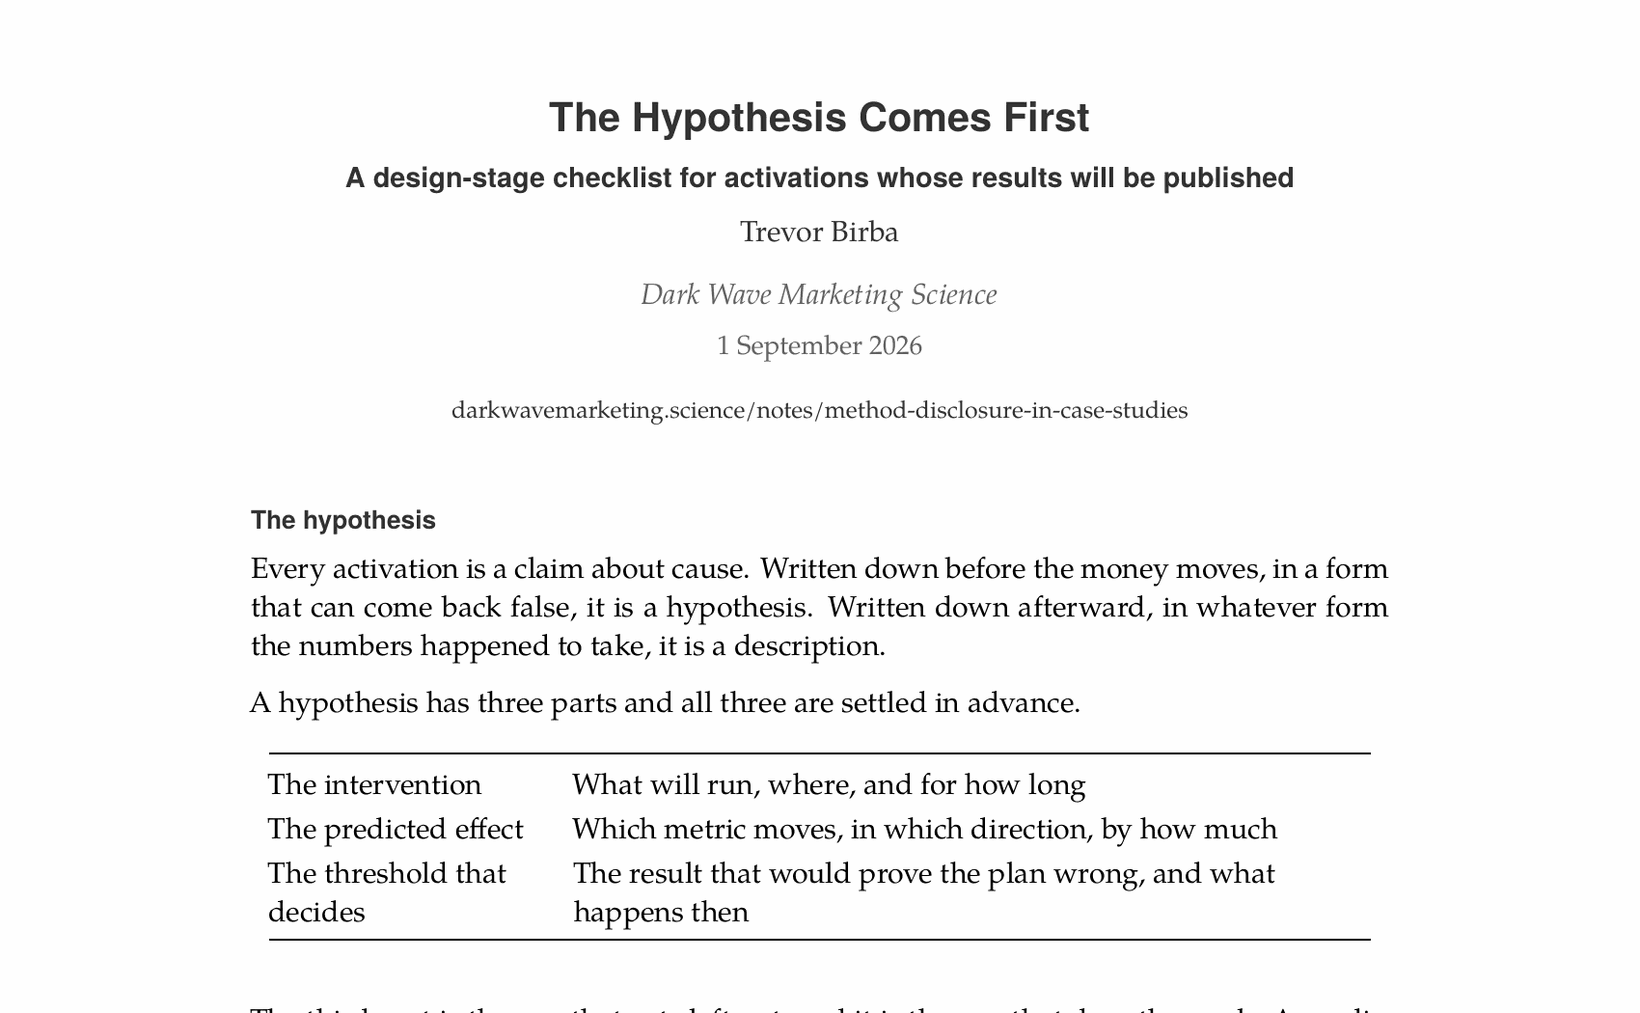
Every activation is a claim about cause. Written down before the money moves, in a form that can come back false, it is a hypothesis. Written down afterward, in whatever form the numbers happened to take, it is a description.
A hypothesis has three parts and all three are settled in advance: the intervention, meaning what will run, where, and for how long; the predicted effect, meaning which metric moves, in which direction, by how much; and the threshold that decides, meaning the result that would prove the plan wrong and what happens then. The third is the one that gets left out and the one that does the work, because a prediction that cannot fail is not a prediction. If no observable result would have changed the recommendation, the campaign was never being measured, it was being justified.
| Strong | Advertising in five feeder markets will raise paid room nights by at least 5 points against three matched markets held dark, read over the flight weeks plus a fourteen-day tail. Under 5 points we do not renew the summer flight. |
| Weak | The summer campaign will drive visitation and build destination awareness. |
The weak version is not false. It is unfalsifiable, which is worse, because it will be reported as a success whatever happens. The five conditions below are what make the strong version answerable, and four of them cost a sentence rather than a budget.
The example that runs through this page
A mid-size destination marketing organization, eight feeder markets, a $400,000 summer flight in five of them and three held dark. The figures are invented and the mechanics are not. Its end-of-season report opened with this sentence.
Our summer campaign drove a 31% lift in visitation.
Each condition below edits that claim. By the fifth it has grown from one sentence into a short paragraph, the number has lost nine tenths of its size, and what is left is something a board cannot take apart.
1. The denominator
What is the number a proportion of, and can you read it today?
A baseline assembled after the flight is a baseline that was chosen, so the quantity and its source have to be fixed while it is still possible to be wrong about them.
| Strong | Paid room nights in the five feeder markets, from the STR report, running at 18,400 a week across the eight weeks before launch. |
| Weak | Visitation, taken at the end from whichever panel had the cleanest numbers. |
Across 6,815 published case studies we read, a numeric baseline is absent from 99.2% of claims. It is the most frequently missing of the five and the cheapest to supply.
The 31% counted devices that saw an ad and later appeared in market, which is a proportion of exposed devices rather than of visitors. Read on a quantity the organization already receives every month, the same season is up 12.0%.
What this does to the claim
BeforeOur summer campaign drove a 31% lift in visitation.
Our summer campaign drove a 31% 12.0% lift in visitation increase in paid room nights. That is against the 18,400 a week our five feeder markets ran before the flight.
2. The comparison condition
What is the result measured against, and is that settled now?
An instrument that can only register the effect where the intervention ran cannot return a null, which makes it a validator rather than a measurement, and this is the one condition on the list that asks for work rather than a sentence.
| Strong | Three feeder markets selected on pre-period fit and held dark, frozen on 12 May before any campaign data was seen. |
| Strong | No comparison was constructed. The figure is descriptive and is reported as such. |
| Weak | Against last summer. A panel that reports campaign-influenced arrivals only for the devices that saw the campaign. |
The explicit no is a passing answer. A descriptive number labeled as descriptive costs nothing and forecloses the objection. A descriptive number presented as a causal one is the failure this checklist exists to prevent.
The dark markets had no advertising at all and still grew 5.8%, because the season was strong everywhere. Whatever the campaign did, it did not do the first 5.8 points of it. The unit changes at this step and the change is not cosmetic: 12.0% was a growth rate, 6.2 points is the gap between two growth rates, and only the gap is attributable to the campaign. Every figure from here on is counted in points for that reason.
What this does to the claim
BeforeOur summer campaign drove a 12.0% increase in paid room nights. That is against the 18,400 a week our five feeder markets ran before the flight.
Our summer campaign drove a 12.0% 6.2 point increase in paid room nights. That is measured against the three feeder markets we held dark, which grew 5.8% on their own, and against the 18,400 a week our five feeder test markets ran before the flight.
“While I have you, would you like to take something to go?”
3. The window
What period is being read, and is it locked before launch?
A window selected once the data is visible is a result selected once the data is visible.
| Strong | 8 June to 9 August, the flight weeks plus a fourteen-day tail, fixed at kickoff because carryover in this channel decays inside ten days. |
| Weak | The summer. June through August. The period in which the effect appeared. |
The period is absent from 84.9% of published claims in the corpus.
The flight ran 8 June to 26 July. Reading the whole season pulled in a festival weekend and a heat wave in late August that lifted every market, advertised or not.
What this does to the claim
BeforeOur summer campaign drove a 6.2 point increase in paid room nights. That is measured against the three feeder markets we held dark, which grew 5.8% on their own, and against the 18,400 a week our test markets ran before the flight.
Our summer campaign drove a 6.2 4.9 point increase in paid room nights. That is measured against the three feeder markets we held dark, which grew 5.8% on their own, and against the 18,400 a week our test markets ran before the flight. The window is the flight weeks plus a fourteen-day tail, locked at kickoff, not the full June to August season.
4. Concurrent activity
What else runs inside that window, and what happens if it lands in a test cell?
Deciding after the fact what counts as interference is deciding with the result in view, so the list and the rule are both written at kickoff.
| Strong | Four items enumerated at kickoff with a rule attached: any test market carrying the state co-op flight drops out of the read, agreed before the co-op calendar was final. |
| Weak | Other factors were taken into account. |
Enumerated concurrent activity is absent from 82.4% of published claims.
The state tourism office ran a co-op flight in three of the five test markets. The rule written at kickoff drops them, which costs three fifths of the sample and buys the only version of the number that is attributable to this campaign.
What this does to the claim
BeforeOur summer campaign drove a 4.9 point increase in paid room nights. That is measured against the three feeder markets we held dark, which grew 5.8% on their own, and against the 18,400 a week our test markets ran before the flight. The window is the flight weeks plus a fourteen-day tail, locked at kickoff, not the full June to August season.
Our summer campaign drove a 4.9 3.4 point increase in paid room nights in the two test markets that carried no state co-op flight. That is measured against the three feeder markets we held dark, which grew 5.8% on their own, and against the 18,400 6,700 a week our test those two markets ran before the flight. The window is the flight weeks plus a fourteen-day tail, locked at kickoff, not the full June to August season.
5. The source of the figure
Who produces the number?
A firm that buys the media and also reports the lift is grading its own homework, and saying so plainly costs less than being asked.
| Strong | Calculated by our analyst from the STR report. The attribution panel reported the same campaign at nine times the size, for the reasons in the appendix. |
| Weak | A number with no provenance. Two figures from two systems, reconciled silently. |
The source of the figure is absent from 94.7% of published claims.
This is the only one of the five that does not move the number. It decides whether the number survives the first person who asks where it came from.
What this does to the claim
BeforeOur summer campaign drove a 3.4 point increase in paid room nights in the two test markets that carried no state co-op flight. That is measured against the three feeder markets we held dark, which grew 5.8% on their own, and against the 6,700 a week those two markets ran before the flight. The window is the flight weeks plus a fourteen-day tail, locked at kickoff, not the full June to August season.
Our summer campaign drove a 3.4 point increase in paid room nights in the two test markets that carried no state co-op flight. That is measured against the three feeder markets we held dark, which grew 5.8% on their own, and against the 6,700 a week those two markets ran before the flight. The window is the flight weeks plus a fourteen-day tail, locked at kickoff, not the full June to August season. The figure is STR data pulled by our own analyst, not the attribution panel that also sold us the media.
Started with this, ended with that
The same five edits in one view. Step through them and watch which parts of the sentence were never there to begin with.
31%
Lift in visitation, as the report published it
Our summer campaign drove a 31% lift in visitation.
Thirteen words, no method, and nothing in it a reader can check.
The finished claim is four sentences where the original was one, and that is the whole of the difference. Three and a half points on 60,300 room nights is roughly 2,050 incremental nights, about $369,000 in lodging at a $180 average rate, against the $150,000 of flight that landed in those two markets. That result renews the budget. The 31% dies the first time a board member asks what it is a percentage of.
Why this is not in your launch checklist
Operational pre-flight lists are good at what they do. Creative approved, tracking firing, UTMs consistent, budget pacing, audiences built. All of it is necessary and none of it decides whether the number at the end supports the sentence written next to it.
That gap is measurable. We read 6,815 published case studies from 369 firms that place media on a client's behalf and found that 69.4% of those firms show no comparison condition of any kind anywhere on their site. Among the firms whose own sites describe running controlled experimental designs, 76.6% of their published claims still sit on a page that states no method. The capability is not the constraint. The convention is.
Common questions
Is a year over year comparison good enough?
It is a comparison but not a control. Year over year carries every other difference between the two periods along with the campaign: pricing, distribution, competitors, weather, the economy. It is acceptable when labeled as descriptive and reported as such.
What if we cannot run a holdout?
Then say so. Stating explicitly that no comparison was constructed is a passing answer under this checklist, and it is free. The failure is not the absence of an experiment. It is a descriptive number presented as a causal one.
Does this mean every campaign needs a test?
No. Four of the five conditions require no experiment at all, no additional budget, and no capability a firm running media does not already have. They are the ones most reliably missing, which is the evidence that this is a convention gap rather than a capability gap.
Who is this for?
Agencies who will publish the result, and advertisers who will be shown it. Both are better off if the conditions are settled at the same meeting where the budget is.