Dark Wave Marketing Science Ask Carlos

Research

Funny Numbers: self-published marketing results and prevalence of undisclosed methodology

We read 6,998 marketing case studies published by 369 firms that place media on a client’s behalf. The agencies that demonstrably run controlled experiments withhold the method as often as everyone else.

Trevor Birba, Dark Wave Marketing Science ·

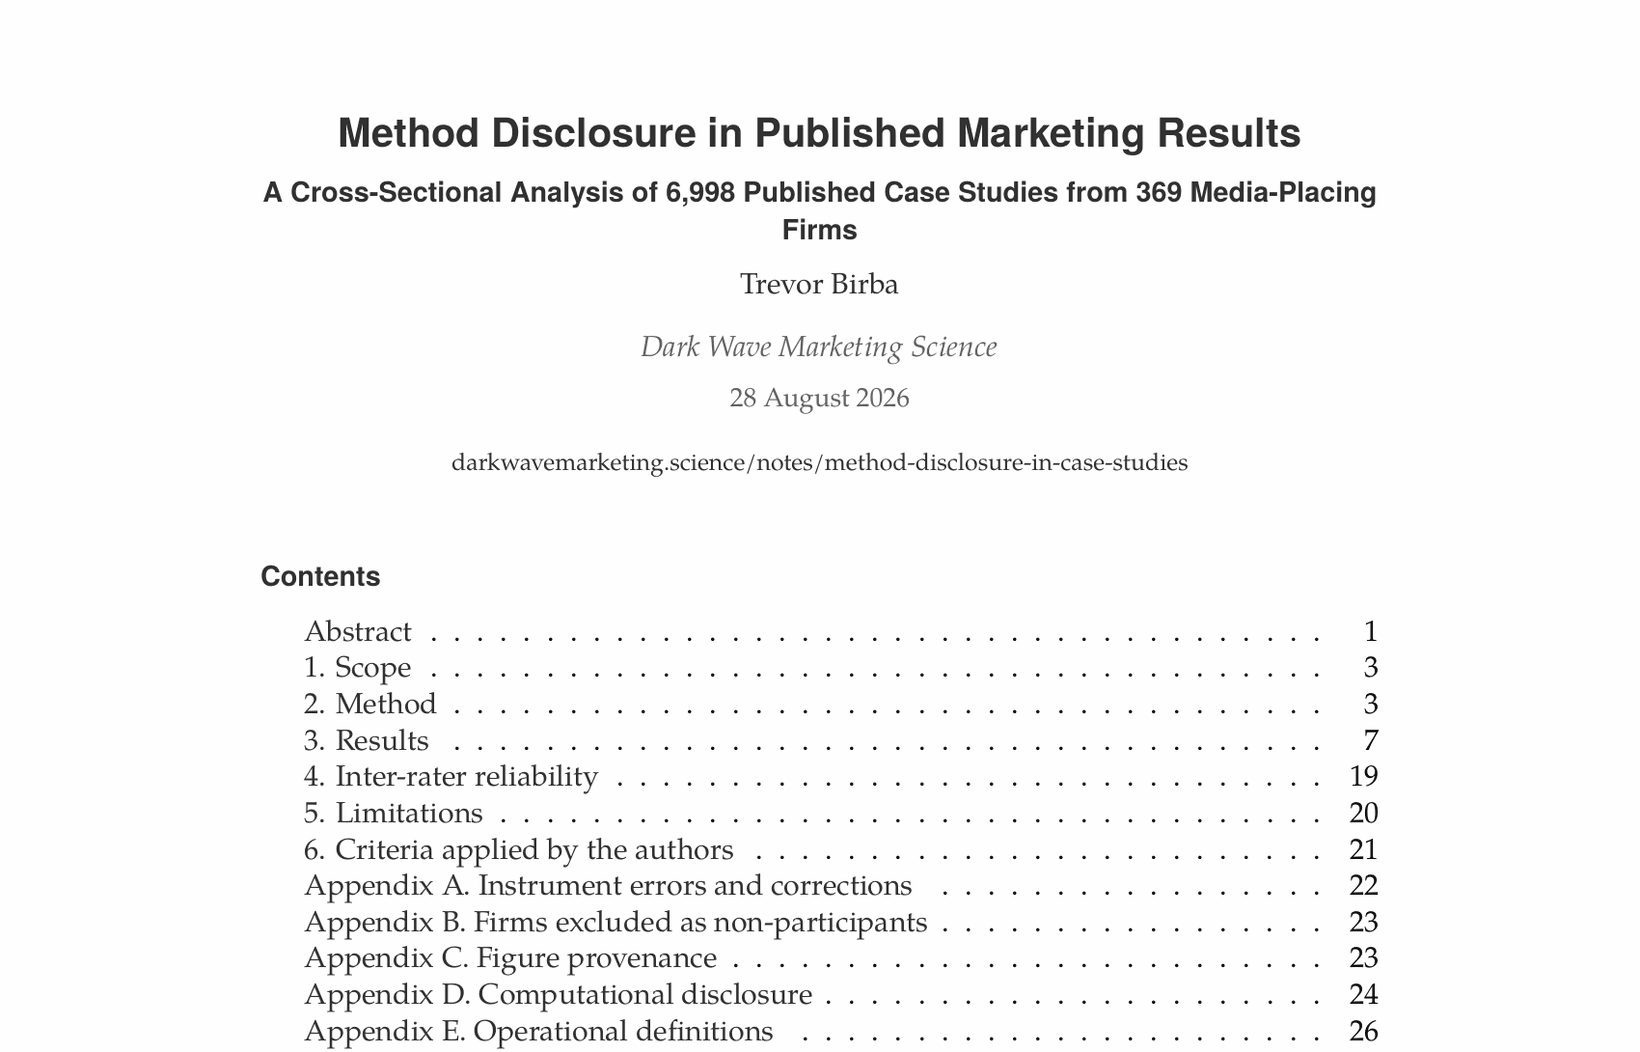
The first page of the paper, Method Disclosure in Published Marketing Results, showing the title, author and table of contents

Method Disclosure in Published Marketing Results

69.4%of firms show no comparison condition anywhere on their site
13.8%ever describe running a named experimental design
76.6%of the claims published by that 13.8% still carry no method on the page
86.9%of case studies show no comparison of any kind

A published number carrying no method is not a weakly supported causal claim. It is not a causal claim at all. “Bookings rose 47%” and “we drove a 47% increase in bookings” are different propositions requiring different evidence, and only the second requires a method. The industry publishes the first construction and is read as having asserted the second.

Of 369 firms that place media on a client’s behalf, 256 show no comparison condition of any kind anywhere on their site. A firm leaves that band by describing a comparison once, on any page. Seven in ten do not. Narrow to the 51 whose own sites describe experimental designs they ran, and 76.6% of their 4,820 published claims still appear on a page that mentions no method in any form: not the design, not a comparison group, not a test, not a measurement partner, not a period.

The findings

What 6,998 marketing case studies show

Three results, each of which removes an explanation a reader would otherwise reach for.

Capability does not produce disclosure
0%25%50%75%100%median firm 86.1%each row = one design-running firm (n=51)share of that firm's own claims with NO method on the page

Each point is one of the 51 firms whose own site describes an experimental design it ran, placed at the share of its published claims carrying no method. Capability is constant across the strip, so the spread is publishing practice alone. Four firms disclose on every claim. The median firm discloses on 13.9% of them.

It is the firm, not the client’s industry
Raw disclosure ratepercent of pagesDeviation from the firm's own averagepercentage points, 95% interval0102030-100+10CPG & retailMulti-locationEcommerce & DTCCredit unionTourismHealthcareAutomotiveB2B techLegalReal estateHigher edNonprofitdashed line = no differenceordering does not transfer →

Left, the raw disclosure rate by client vertical, a twelve-fold spread. Right, the same verticals as deviation from each publishing firm’s own average, across the 144 firms publishing in two or more; the dashed line is no difference. Rows keep their order and the left-hand ranking does not transfer. Only real estate separates from its own firms’ baseline. Between-firm differences explain 51.9% of the variance in disclosure; verticals, 4.8%.

The middle of the market is the most exposed
Ever describes a named designpercent01020304010.01-10n=1017.511-50n=4028.651-200n=3538.5201-+n=13Case study pages stating a methodpercent01020304013.01-10n=1012.711-50n=404.351-200n=3530.1201-+n=13headcount band →monotoneno gradient

Left, the share of firms in each headcount band ever describing a named design. Right, the share of their case study pages stating a method. Both panels are percentages on one scale and are read independently. Capability behaves like a fixed cost and climbs with size, 10.0% to 38.5%. Disclosure does not follow it, falling to 4.3% between fifty and two hundred people. Headcount was available for 98 firms.

Disclosure is a house style. It is set at the firm and it travels with the firm across everything it publishes. Two competing explanations are unavailable by construction. That the firm did not measure: excluded, because every firm in that first panel published a description of a design it ran. Client confidentiality: also excluded, because these are marketing pages the firm chose to publish, and the client is frequently named while the method is not.

The size of the number carries no information either. We preregistered the expectation that larger claimed results would be the less supported ones. Disclosed and undisclosed claims have the same median magnitude, 51% against 50%. No rule of thumb protects a reader from the big figures, which leaves the disclosure itself as the only available signal, and the disclosure is absent three quarters of the time.

The reading

A convention nobody chose

Four properties a reader needs in order to interpret a percentage are near-universally absent. A numeric baseline is missing from 99.2% of claims, the source of the figure from 94.7%, the period from 84.9%, and enumerated concurrent activity from 82.4%. They are absent at between 91% and 99% in every vertical and at every tier of methodological capability. There is no subgroup in this corpus where a reader is adequately served.

Four of the five conditions below cost a sentence. Stating what a percentage is calculated from, over what period, alongside what other activity, and from what source requires no experiment, no budget and no capability a firm does not already have. Only a comparison condition requires doing more work. The costless ones are the ones missing, which is the evidence that this is a convention gap rather than a capability gap.

What we require of a number

The conditions we apply before we will stand behind a figure, published because a paper about disclosure should disclose its own. They are not proposed as a standard for anyone else to adopt.

  1. A numeric baseline. What the figure is a proportion of, in quantities a reader could check.
  2. A comparison condition. What the result is measured against, or an explicit statement that no comparison was constructed.
  3. A stated period, and whether it was fixed before the result was seen.
  4. Concurrent activity, enumerated, where several activities ran together.
  5. The source of the figure. Platform-reported, firm-calculated, or independently produced.

What this study cannot say

Accuracy is not observed, and no claim here is that any published number is false. Published pages are observed, not what a firm tells its client, and inconsistent disclosure does not imply inconsistent rigor. The corpus is regionally and vertically weighted and is not representative of the industry. Every claim in it was selected for publication by the firm that produced it, with every incentive to demonstrate rigor, so every rate reported is a floor on non-disclosure rather than an estimate of it. Automated classification carries measured error, reported per property in the paper.

Two of the notes here work the same seam from the other side: last-click is a reporting convention, not a measurement method, and why your platforms disagree with each other. Both are about numbers that carry a definition nobody states.

Competing interests. Dark Wave Marketing Science sells measurement services, so a study finding that measurement is poorly disclosed is self-serving on its face. We raise it first because it is the first thing a reader should ask, and we have tried to answer it by printing the operative patterns in full, recording every failure found in the instrument, including one that would have manufactured the expected result, and reporting the hypothesis that came back null.

Data and code. The derived census records and the scripts that reproduce every figure are available on request at trevor@darkwavemarketing.science and are being prepared for release. Raw crawled page text is not redistributed, but every claim record carries its source URL, so any figure can be checked against the live page.

If you already run the designs

The gap this study measures is usually in how a result was written up rather than in how the work was done. That is a cheaper problem than it looks, and a conversation worth having.